


2019 China Special Vehicle Market Sales Analysis
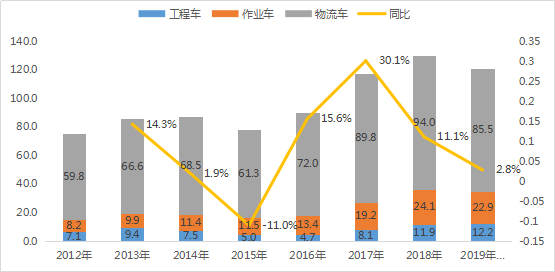
In 2018, China‘s special vehicle market sold 1.30 million units, an increase of 11.1% year-on-year. Among them, the sales of logistics special vehicles were 940 thousand units, an increase of 4.8% year-on-year, and the market share was 72.3%, a decrease of 4.4 percentage points from 2017;
The sales volume of special engineering vehicles was 119,000, an increase of 46.4% year-on-year, and the market share was 9.2%, an increase of 2.2 percentage points from 2017; the sales volume of special purpose vehicles was 241,000, an increase of 25.7%, and the market share was 18.5% In 2017, it increased by 2.2 percentage points.
From January to November 2019, China‘s special vehicle market sold 1.206 million units, a year-on-year increase of 2.8%. Among them, the sales volume of logistics special vehicles was 855,000 units, an increase of 1.1% year-on-year, and the market share was 70.9%, a decrease of 1.2 percentage points from the same period in 2018;
.png)
The sales volume of engineering special vehicles was 122,000 units, an increase of 12.1% year-on-year and a market share of 10.1%, an increase of 0.8 percentage points from the same period in 2018;
The sales volume of special vehicles for operations was 229,000, an increase of 4.5% year-on-year, and the market share was 19.0%, an increase of 0.3 percentage points from the same period in 2018.
Judging from the monthly sales volume of hazardous chemical transport vehicles, sales from January to April 2019 are on the rise, and sales from May to August began to fall, which was a year-on-year decline from 2018.
From September to November, the sales volume picked up again. In November, the sales volume was 2101 units, an increase of 63.6% year-on-year; from January to November, the total sales were 14398 units, an increase of 0.1% year-on-year. (This article does not include dangerous goods transport semi-trailers, only refers to bicycles)
Judging from the changes in the distribution of the types of dangerous goods transport vehicles, the market for dangerous goods transport vehicles is mainly fuel trucks and fuel trucks.
The proportion of January-November 2019 is close to 50%. From the perspective of share trends, the market share of transportation vehicles has increased year by year, and the proportion of fuel trucks has declined year by year; the market share of blasting equipment transportation vehicles has remained above 15%.
Judging from the changes in the distribution of the types of dangerous goods vehicles, the market for dangerous goods vehicles shows a trend of development at both ends. The proportion of heavy and light trucks has increased, and the proportion of medium-sized trucks has declined.
From January to November 2019, the proportion of heavy trucks reached 38.8%, the proportion of light trucks was 31.3%, and the proportion of medium trucks was 29.9%.
From the perspective of the competitive landscape of the hazardous chemicals transportation vehicle market, the TOP10 companies‘ market concentration of hazardous chemicals transportation vehicle sales is 55.8%, which is 2.1 percentage points lower than the same period in 2018, and the corporate concentration has declined.
Statistics show that from January to November 2019, a total of 80 companies achieved sales, of which 12 sold more than 500 vehicles.
Hubei Chengli topped the list with 1315 sales and 9.1% market share. Among TOP10 companies with sales volume, XCMG Chusheng‘s sales fell 49.6% year-on-year, Suizhou Lishen‘s sales fell 0.8% year-on-year, Shandong Zhengtai Hill‘s sales fell 4.3% year-on-year, and other companies‘ sales increased year-on-year.
.png)
.png)
 Mailme
 18672222184